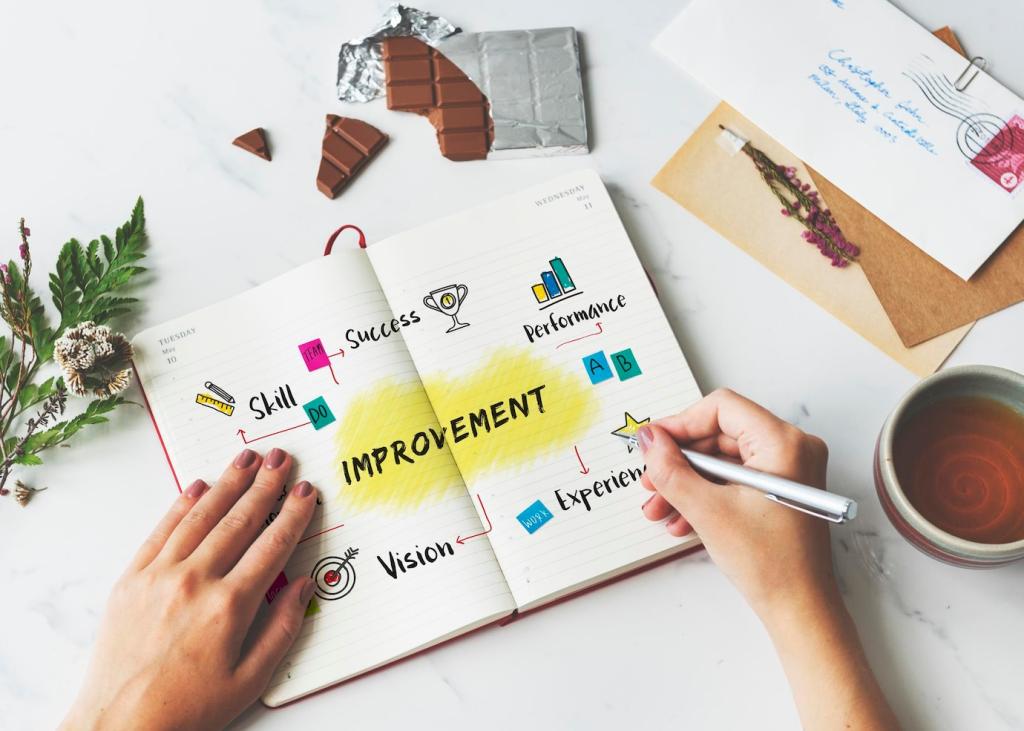
Lean Six Sigma for Process Improvement
Start with Why: Value First

Translate the Voice of the Customer into measurable CTQs so teams know exactly what good looks like. Ask customers what frustrates them most, then prioritize that pain. Share your top customer complaints in the comments, and we’ll turn them into focused metrics you can actually manage every day.
Measure with Confidence: Data That Drives Decisions
01
Baselines and Operational Definitions
Before improving, know your baseline and define every metric the same way, every time. In a warehouse, clarifying when an order is considered ‘picked’ revealed hidden delays. Share your current baseline metric and how you define it, and we’ll help pressure-test for ambiguity that can distort results.
02
Collecting Clean Data, Not Just More Data
More data is not better data. Use sampling strategies and MSA or gauge R&R to confirm your measurements reflect reality, not instrument noise. One team discovered a scanner lag that inflated cycle times. Audit your measurement steps this week and report one suspected distortion to explore in your next standup.
03
Visualizing Flow and Variation
Run charts, histograms, and box plots transform tables into stories. When a support desk plotted daily tickets, natural weekly cycles appeared, not chaos. Visualize your key metric for two months, spot patterns, and comment with your read; we’ll suggest the next best chart to deepen insight.
5 Whys That Reveal the Truth
Ask ‘why’ until assumptions crack and root causes surface. A packaging line’s damaged cartons traced to a loose guide rail, not rushed staff. Try five respectful whys with your team, write what you learn on a single page, and share your surprising third why in the discussion.
Fishbone and Pareto in the Wild
A fishbone diagram captures hypotheses across Methods, Materials, Machines, People, Measurement, and Environment. Pareto separates the few vital from the many trivial. In a café, 80% of order errors came from two menu items. Post your top error types ranked by frequency, and we’ll brainstorm targeted experiments.
Improve with Experiments: Fast, Frugal, Focused
Kaizen Bursts and A3 Thinking
Use A3 storytelling to frame context, root cause, countermeasures, and follow-up on a single sheet. During a kaizen burst, one team rebalanced tasks to cut cycle time by 28% in two days. Try drafting a one-page A3, share one countermeasure idea, and invite a peer to poke holes constructively.
Designing Safe Pilots
Pilot changes on a small scale with clear success criteria, a timebox, and rollback plans. A fulfillment group tested new bin labels on only two aisles first. Pick a pilot scope you can reverse in an hour, define your metrics upfront, and tell us your go/no-go rule before you begin.
Poka‑Yoke and Standard Work
Error-proofing beats error-catching. A simple connector shape prevented wrong plugs; a checklist made critical steps unforgettable. Write standard work with visuals and tactile cues, then test with a newcomer. Comment with one step people often miss, and we’ll suggest a poka‑yoke to make the right way the easy way.

Control and Sustain: Make It Stick
Choose the right chart—p, u, X‑bar, or individuals—so signals stand out from noise. A service team used an I‑MR chart to notice a subtle shift after onboarding. Start a simple weekly chart for your lead time, review with the team, and share your first genuine signal, not a false alarm.
Control and Sustain: Make It Stick
Make the process visible with boards, andon signals, and clear standards at the point of work. Ten-minute huddles turn charts into action. Post your board layout or daily agenda, and we’ll recommend one tweak to link owner, metric, and countermeasure so improvements compound instead of fade.
Control and Sustain: Make It Stick
Lock in gains with control plans, training refreshers, and lightweight audits. One manufacturer created a playbook page for each change with photos and QR links. Build a one-page control plan for your latest fix and comment the link; we’ll review for clarity and long-term resilience.

The Two-Minute Label That Saved Hours
A tiny change—color-coded labels on return totes—cut searching by half and restored calm during peak hours. The team celebrated with coffee, not confetti, and kept going. Share your smallest win that delivered outsize impact, and inspire someone to try a low-risk experiment before lunch tomorrow.
From Blame to Curiosity
A leader swapped ‘Who messed up?’ for ‘What in the process allowed this?’ and morale shifted overnight. People started bringing evidence instead of excuses. Try that language in your next review, then report back. Your comment might nudge another manager toward a more courageous, data-driven conversation.
Your Turn: What Will You Improve Next?
Pick one workflow, one metric, and one experiment this week. Keep it observable, measurable, and reversible. Post your plan below—context, baseline, hypothesis, and how you’ll sustain if it works. We’ll cheer you on, share templates, and highlight community results in our next newsletter.
